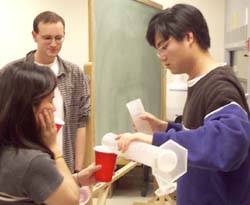
| On the day of the experiment, obtain your baseline sample, then drink the beverage chosen by your lab section for your treatment group. Don't forget to measure the volume of beverage calculated according to your weight! |
 |
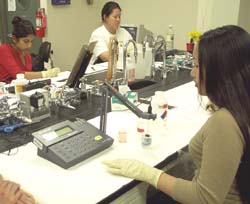
| You can measure the volume, sodium concentration, and pH of your own samples. |
 |
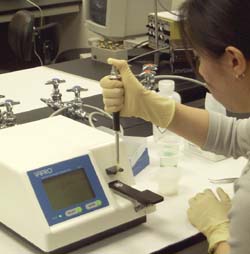
| Use a vapor pressure osmometer to measure the osmolality of urine. |
 |
| Enter your data into the Excel template and view graphs of each parameter instantly. Copy the data into a StatView dataset to perform the repeated measures ANOVA. (Click on this picture for a larger image in a new window.) |
 |
| |
| Visit the renal control lab page for an overview of this lab, readings, and useful links. |