| This is a Ussing chamber. It allows you to study the properties of a semi-permeable artificial membrane. This membrane is sandwiched between the left and right halves, dividing the chamber into two compartments. The two electrodes fit into access ports on top. |
 |
| You must decide which salt solution to use and what concentrations of that salt to add to each compartment in each trial. Before you start the experiment, use the Nernst equation to predict what potential difference (in millivolts) you would expect in each trial if the artificial membrane is cation (+) permeable or anion (-) permeable. |
 |
| All set? Carefully fill the two sides of the chamber with the test solutions using the syringes. |
 |
| Now insert the electrodes and begin recording the membrane potential on the computer. When it stabilizes, record the equilibrium potential in the Excel spreadsheet. |
 |
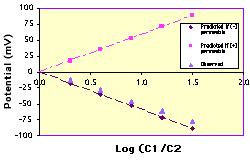
| Examine your data on the Excel graph (click on it for a larger view in a new window). Does your membrane appear to be anion permeable or cation permeable? Export your data to StatView and perform a linear regression to determine whether the slope matches the coefficient of the Nernst equation. |
 |