Introduction to
Ecological Genetics
Darwin’s Four Postulates
Individual variation (phenotypes vary, ecology and genetics)
In every generation, more progeny produced than can survive (population
dynamics, ecology)
Survival and reproduction of individuals not random
Within the current conditions, individuals with some phenotypes produce
more offspring, find more mates, survive better (i.e. are more fit)
These individuals are selected by environment (ecology)
Some phenotypic variants passed on to offspring (heritable information, genetics)
Thus, more fit phenotypes are better represented in the next generation (evolution)
Published in: Darwin, C. 1859. On the Origin of Species by Means of Natural
Selection, 1st edition
See online facsimile:
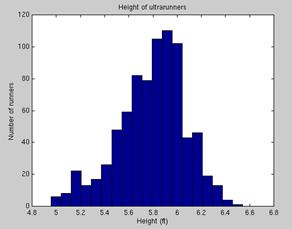
Individual variation (phenotypes vary)
Height histogram
Calculate mean and variance
Mean

Variance
Compare with runners’ height histogram
Runners from research unit at University
of Indiana in Bloomington,
IN
2. In every
generation, more progeny produced than can survive
Darwin read Malthus’ treatise
on population growth
See online HTML version
Population growth models
Exponential growth

To read more about exponential growth
Not all progeny can survive
Carrying capacity

Density-dependent growth

To read more about logistic growth
Examples of using r to measure
fitness
Bennett, A.F., Lenski, R.E., & Mittler, J.E. (1992).
Evolutionary adaptation to temperature I. Fitness responses
of Escherichia coli to changes in its thermal environment. Evolution,
46:16-30.
//links.jstor.org/sici?sici=0014-3820%28199202%2946%3A1%3C16%3AEATTIF%3E2.0.CO%3B2-O
Back to Darwin
Survival and reproduction of individuals not random
Within a particular environment, individuals with certain phenotypes
survive and reproduce better than others
These are the selected
individuals
Fitness
Metric to measure selection
Note: Fitness itself is a phenotype
Like all phenotypes, it varies with the environment
Measure fitness as population growth rate
Early example: Gause, G. F.
1934. The Struggle for Existence. Hafner
Press, NY
Online HTML with facsimile figures
Yeast Monocultures
Found logistic growth with carrying capacity of 8.70 units
Note early exponential phase of growth, which could be used to estimate r
Yeast Mixed cultures
Result
Still logistic growth
Looking at r during exponential
phase, Saccharomyces has higher
fitness than does Schizosaccharomyces
Modern use of same method for E. coli
Bennett, A.F., Lenski, R.E., & Mittler, J.E. (1992).
Evolutionary adaptation to temperature I. Fitness responses of Escherichia coli to changes in its
thermal environment. Evolution, 46:16-30.
//links.jstor.org/sici?sici=0014-3820%28199202%2946%3A1%3C16%3AEATTIF%3E2.0.CO%3B2-O
Studied adaptation to High and Low Temperatures by E. coli.
Used doubling time to estimate fitness of a bacterial lineage
Calculating doubling time
Can use exponential growth model to calculate doubling time
Integrate exponential equation to obtain a population projection equation

Predicts population growth at any time, assuming constant exponential
growth
Mathematically describe doubling time

Substitute into the population projection equation

Divide both sides by N0

Take natural log of both sides

Rearrange to solve for doubling time

ln(2) = 0.6931
Measuring fitness components
Not possible to measure population growth rate of a single genotype for
most organisms
Use fitness components: e.g. fecundity,
survival
For species with complex life histories, fecundity and survival vary with
age
Use age-structured models (life table analysis)
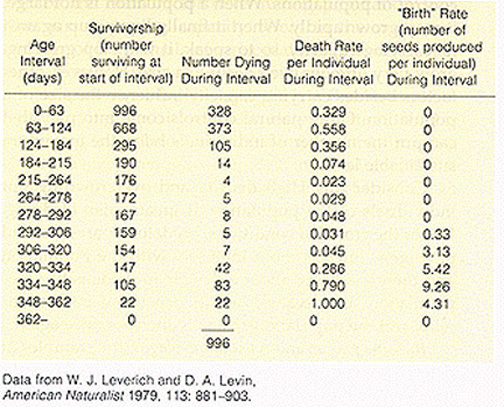
Estimate replacement rate of a phenotype as if growing in a pure
population, R0
If survivorship = probability of survival to age x+1 from age x
And L = life expectancy,
l(x) = prob. of survival from birth to age x (cumulative),
and m(x) = fecundity (# offspring) at age x
Then,  (in stable population)
At low density, replacement rate: 
This equation is a discrete solution to the continuous logistic equation
Other surrogates for fitness
Survival and reproduction of individuals not random (continued)
Selection gradient
Plot fitness value versus phenotypic value
Calculate slope of regression

Where w = relative fitness, z = phenotypic value, a = intercept, b = slope
Directional selection gradient
Selection differential
Change in population mean value of
a trait within a generation
 = population mean
value before selection
= population mean
value before selection
 = population mean
value after selection
= population mean
value after selection
 = selection
differential
= selection
differential
Example: goldenrod ball-galler – Eurosta solidaginis
Eurosta
phenotype = gall diameter
See data from student projects, Williams
College and Culver
College
Gall
Contents
|
Average Diameter
|
Diameter Range
|
Standard Deviation
|
Eurosta solidaginis
|
21.96 mm
|
14.20 - 29.40 mm
|
+/-3.31 mm
|
Eurytoma gigantea
|
17.58 mm
|
15.35 - 20.25 mm
|
+/-2.47 mm
|
All galls
|
21.4
|
12.5 – 29.45 mm
|
+/-3.56 mm
|
Gall Contents
|
Average Diameter
|
Diameter Range
|
Standard Deviation
|
Eurosta solidaginis
|
19.16 mm
|
9.00 – 24.00 mm
|
+/-3.37 mm
|
Eurytoma gigantea
|
15.94 mm
|
6.00 – 24.00 mm
|
+/-4.23 mm
|
All galls
|
18.41 mm
|
6.00 – 24.00 mm
|
+/-3.81 mm
|
Also interesting research on freeze tolerance of the gallers
What’s the selection differential for each population?
What happens in next Eurosta
generation?
Some phenotypic variants passed on to offspring (heritable information)
Darwin was unclear on how this
happened, but knew that it did in some way
If a trait is heritable or phenotypic variants are “genetically
controlled” more fit phenotypes will be better represented in subsequent
generation
Adaptation: evolution by natural
selection
Evolutionary response modeled by Breeder’s Equation
R = s h2
Evolution versus natural selection
Evolution does not equal natural selection
Evolution is descent with modification
Due to any of several mechanisms
Natural selection is a mechanism by which evolution results in
adaptation
Adaptation
Process by which populations become more fit in current environment
Any trait that allows an individual, population, or lineage to be more fit
in current environment
Evolution can happen by processes other than natural selection
These processes modeled by Hardy-Weinberg Equation
Ideal population will not evolve
It is at evolutionary equilibrium
Where allele frequencies will stay at:

Ecology
Explicitly assumed to have no effect
No differential fitness (no selection)
Single population (no gene flow)
No population dynamics (infinite population size)
No behavior (random mating)
Genetics
Explicitly assumed to be “perfect”
Perfect information transfer across generations
No mutation
Perfect translation of genotype to phenotype
No environmental contribution to phenotype
Single gene controls phenotype